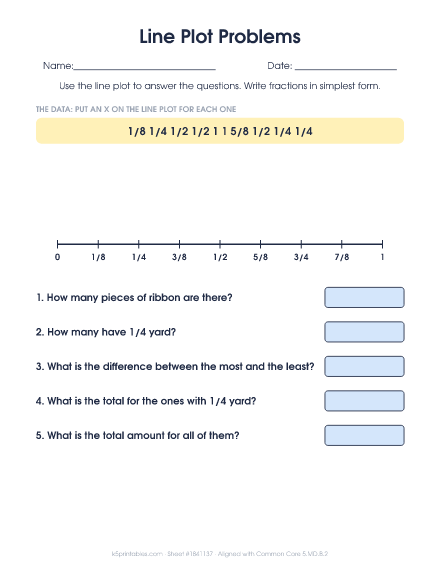
How to Solve Problems with a Line Plot
Use the line plot to find a total, then divide to share it equally.
Need more than one? Tap + for extra copies (up to 10).
How to do it
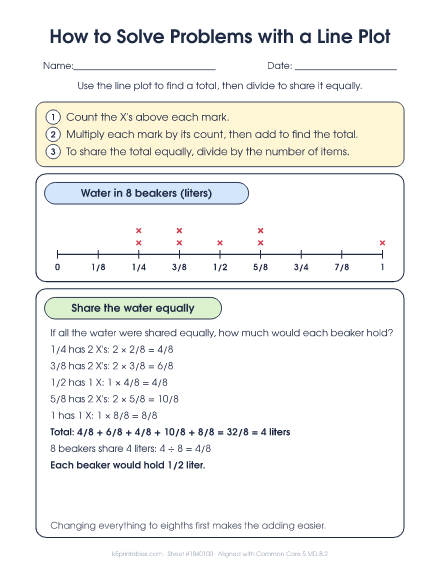
- Count the X's above each mark.
- Multiply each mark by its count, then add to find the total.
- To share the total equally, divide by the number of items.
Teaching tip
The equal share is like an average. If all the water were poured together and poured back out evenly, each beaker would hold 1/2 liter. This sheet is aligned with Common Core 5.MD.B.2.
About this chart
A line plot of water in 8 beakers, with each mark multiplied by its count, the total of 4 liters, and the equal share of 1/2 liter for each beaker.
What kids practice
In 4th grade, students made line plots with fractions and added and subtracted to answer questions. Now they use more of what they know about fractions. They multiply a value by how many times it shows up, add everything to find a total, and divide the total to find what each item would get if it were all shared equally.
Watch for
- Adding the fractions on the number line instead of the values of the X's.
- Missing an item when plotting a list.
- Forgetting to multiply when a value has more than one X.
- Dividing by the wrong number when sharing equally.
It's free to print, as many copies as you need. See the full line plots guide for 5th grade.