Read a Picture Graph
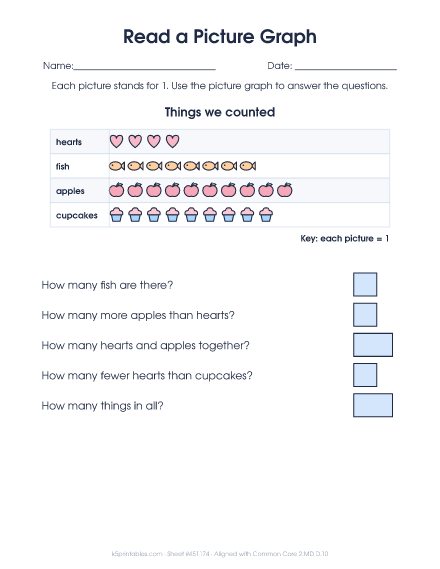
Each picture stands for 1. Use the picture graph to answer the questions.
Fresh sheet anytime. Tap New sheet or reload for a different one. Tap + for up to 10.
This is sheet #45124601.
How to do it
- Count the pictures in each row.
- Each picture is 1.
- Answer the questions.
Teaching tip
Write the number at the end of each row first. This sheet is aligned with Common Core 2.MD.D.10.
About this worksheet
A picture graph with four kinds and five questions about it.
What kids practice
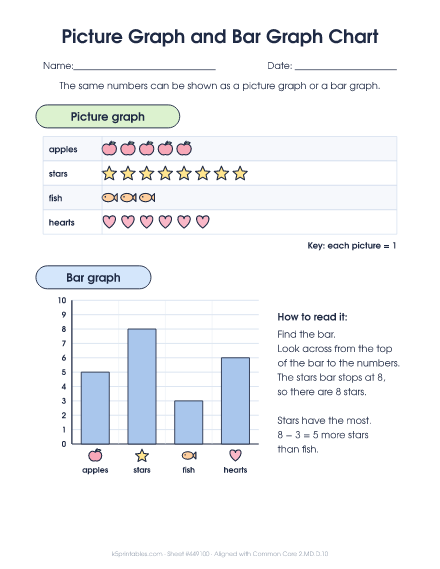
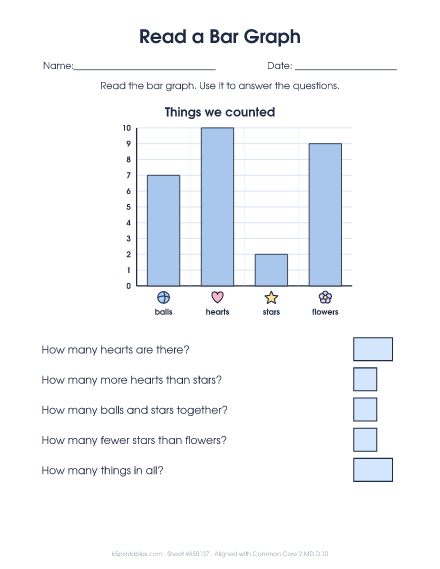
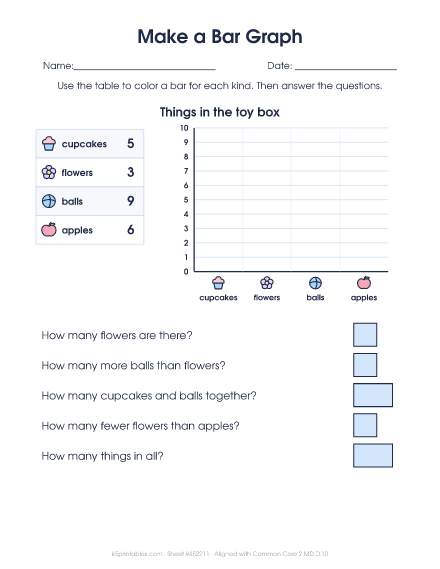
A picture graph uses pictures to show how many of each thing, and a bar graph uses bars against a number scale. Second graders read and make both, with up to four categories, and use them to answer questions like how many more and how many in all.
Watch for
- Reading the number next to the bottom of the bar, or the line above it.
- Adding when the question asks how many more.
- Coloring bars past the number when making a graph.
It's free to print, with an answer key. See the full picture graphs and bar graphs guide for 2nd grade.