Picture graphs and bar graphs worksheets
Aligned with Common Core 2.MD.D.10
Printable second-grade graph worksheets: read picture graphs and bar graphs, make a bar graph from a table, and answer how many, how many more and how many in all.
The worksheets
- See it all
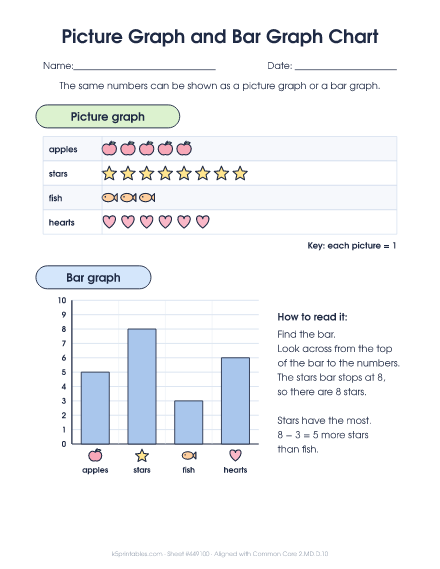
Picture Graph and Bar Graph Chart
The same data shown as a picture graph and a bar graph, with how to read each one.
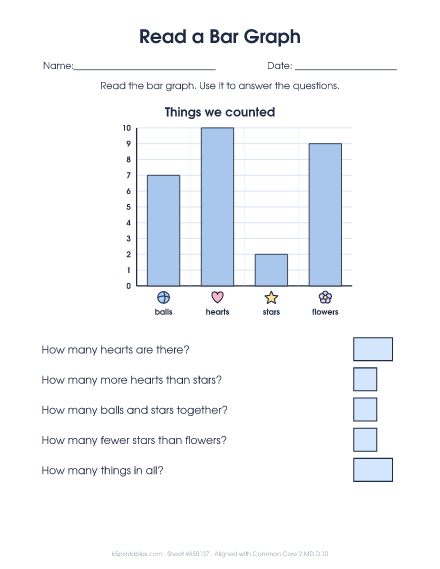
Read a Bar Graph
A bar graph with four kinds and five questions about it.
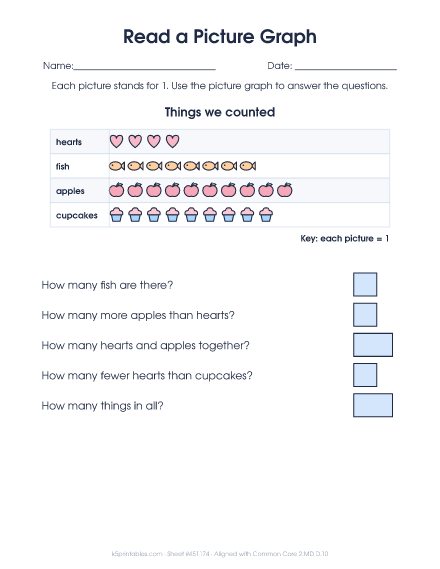
Read a Picture Graph
A picture graph with four kinds and five questions about it.
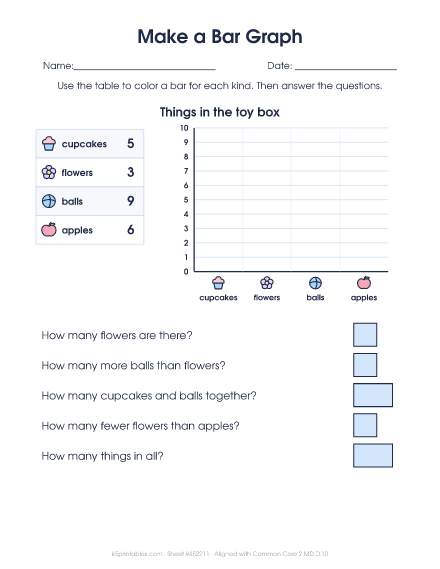
Make a Bar Graph
Color a bar graph from a table of numbers, then answer questions about it.
Print the whole packet
One copy of every sheet above, in order. Tap + for more copies (up to 10).
For the parent or teacher
What it is
A picture graph uses pictures to show how many of each thing, and a bar graph uses bars against a number scale. Second graders read and make both, with up to four categories, and use them to answer questions like how many more and how many in all.
What comes next
Equal shares of shapes, the last 2nd grade math topic.
How to teach it
- Make a graph about your own family, like favorite fruits or socks by color.
- Read a bar by moving your finger straight across from the top of the bar to the numbers.
- Talk about what the graph shows before answering questions.
- For how many more, find both numbers and subtract.
Common mistakes
- Reading the number next to the bottom of the bar, or the line above it.
- Adding when the question asks how many more.
- Coloring bars past the number when making a graph.