Sort, Count and Graph Chart
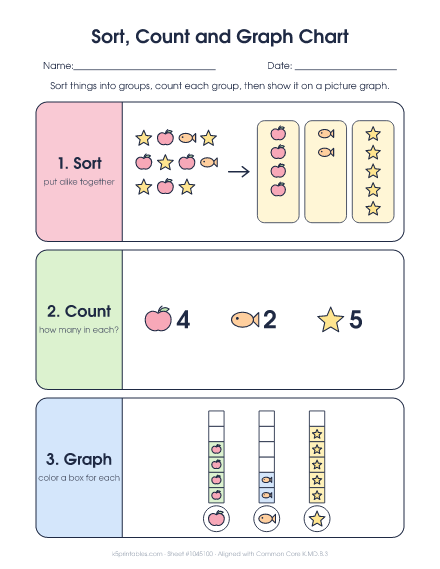
Sort things into groups, count each group, then show it on a picture graph.
Need more than one? Tap + for extra copies (up to 10).
How to do it
- Sort the pictures into groups.
- Count each group.
- Color one box on the graph for each one.
Teaching tip
Do the three steps with real objects first. This sheet is aligned with Common Core K.MD.B.3.
About this chart
The three steps of making a picture graph, shown with apples, fish and stars.
What kids practice
Sorting means putting things that are alike into groups. Kindergartners sort, count how many are in each group, and show the counts on a simple picture graph. Then they use the graph to tell which group has the most or the fewest.
Watch for
- Counting a picture twice or skipping one when they are scattered.
- Coloring graph boxes from the top instead of the bottom.
- Picking the group with the biggest pictures instead of the most.
It's free to print, as many copies as you need. See the full sorting and picture graphs guide for kindergarten.
More sheets in this set
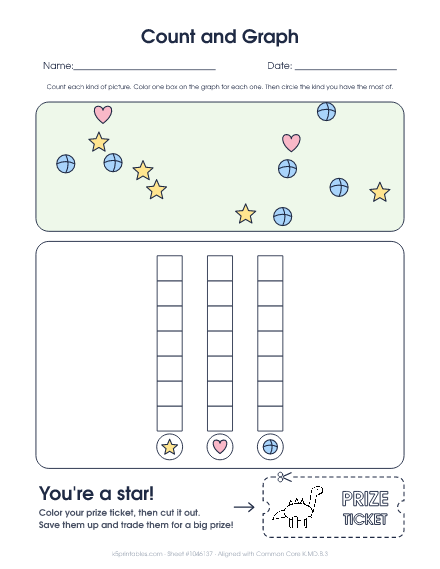 2. Count and GraphA scene of mixed pictures to count and show on a picture graph. Fewer has 2 kinds, Standard 3 and More 4.
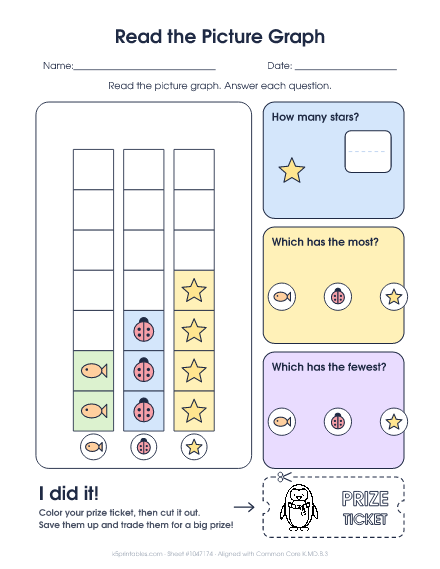 3. Read the Picture GraphA finished picture graph with questions about how many, the most and the fewest.
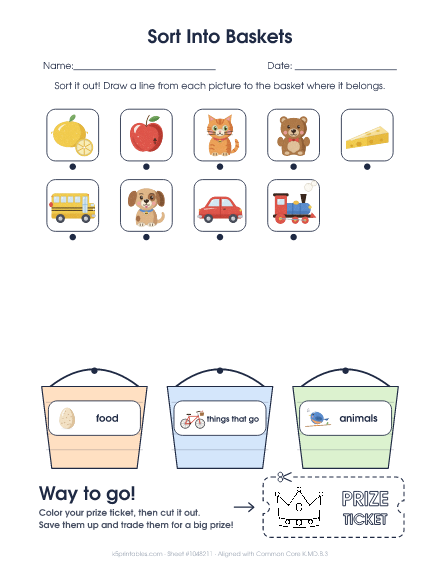 4. Sort Into BasketsPictures to sort into baskets for food, things that go and animals.
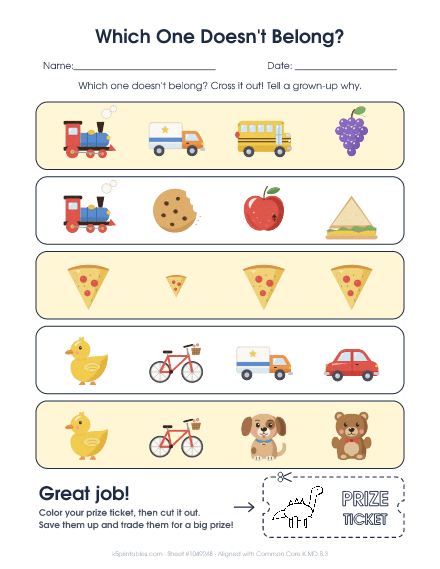 5. Which One Doesn't Belong?Rows of four pictures where one is a different kind or a different size.