Read a Line Plot
Use the line plot to answer the questions.
Fresh sheet anytime. Tap New sheet or reload for a different one. Tap + for up to 10.
This is sheet #146524601.
How to do it
- Read the title and the number line.
- Count the Xs for each question.
- Add or subtract fractions when needed.
Teaching tip
Point to each X while counting. This sheet is aligned with Common Core 4.MD.B.4.
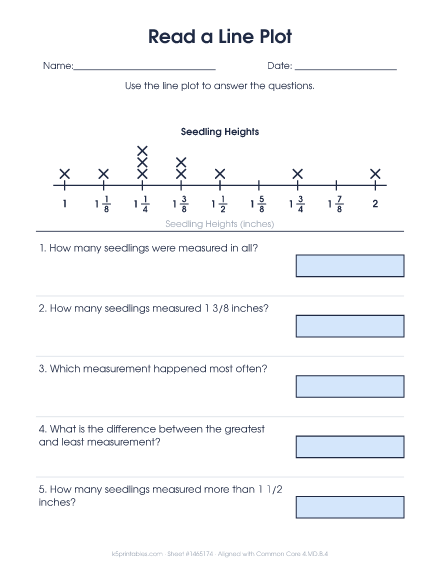
About this worksheet
A line plot with questions about counts, the most common measurement, differences, totals and more than. More has six questions.
What kids practice
A line plot shows data on a number line, with an X for each measurement. In fourth grade the measurements are in fractions of a unit, like 5 1/4 inches or 3/8 liter. Children make line plots from a list of data, then use them to answer questions by adding and subtracting fractions, like finding the difference between the longest and shortest measurement.
Watch for
- Skipping marks on the number line, like jumping from 1/4 to 3/4.
- Plotting a value at the wrong mark, especially with eighths.
- Counting marks instead of Xs.
- Forgetting to change answers like 6/4 to a mixed number.
It's free to print, with Fewer, Standard or More on the page and an answer key. See the full line plots with fractions guide for 4th grade.
More sheets in this set
- See it all
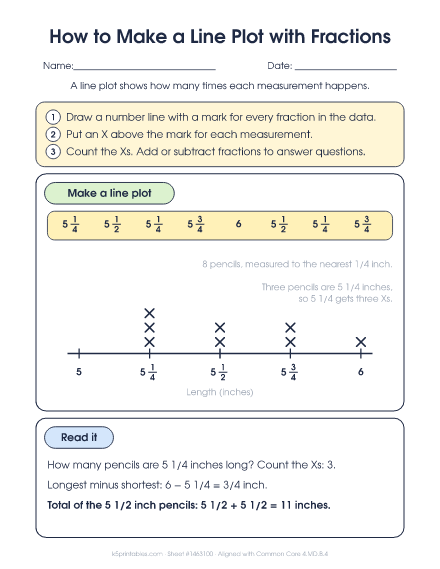 1. How to Make a Line Plot with FractionsEight pencil lengths in fourths of an inch plotted on a line plot, then read to find a count, a difference and a total.
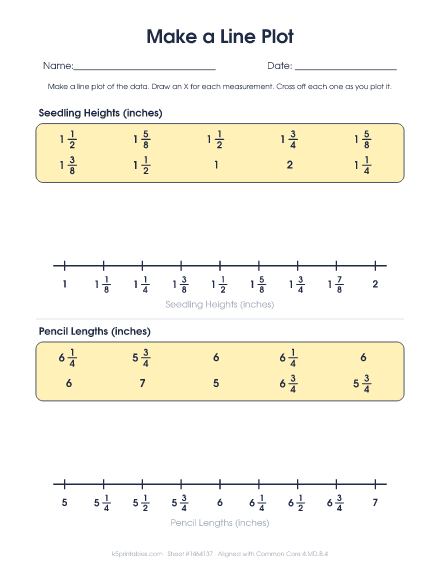 2. Make a Line PlotLists of measurements in halves, fourths and eighths to plot. Fewer has one plot, and Standard and More have two. More uses eighths.
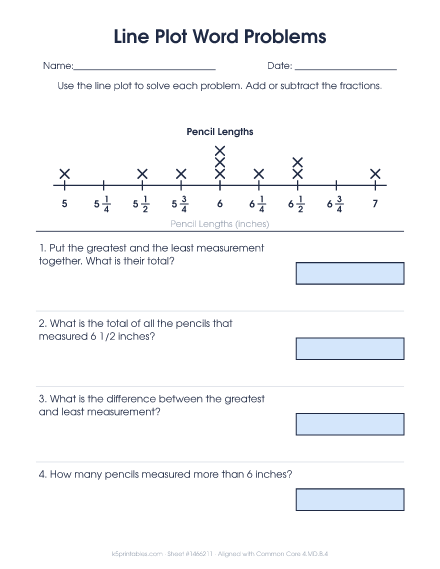 4. Line Plot Word ProblemsA line plot with story problems that add and subtract fractions, like totals and differences.