Make a Line Plot
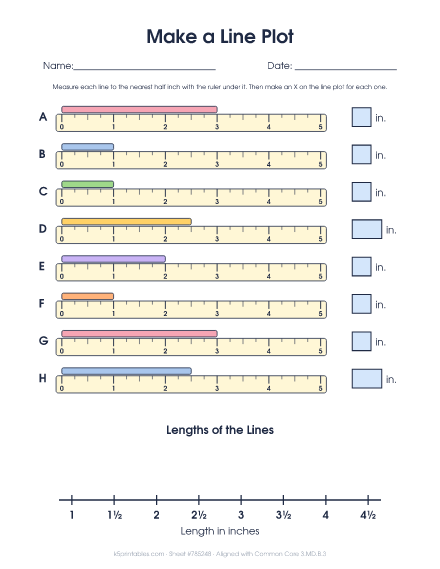
Measure each line to the nearest half inch with the ruler under it. Then make an X on the line plot for each one.
Fresh sheet anytime. Tap New sheet or reload for a different one. Tap + for up to 10.
This is sheet #78524601.
How to do it
- Measure each line with the ruler printed under it.
- Write each length to the nearest half inch.
- Make an X on the line plot for each length.
Teaching tip
Each line has its own ruler printed under it, so the page measures correctly at any print size. This sheet is aligned with Common Core 3.MD.B.3.
About this worksheet
Measure lines to the nearest half inch with the printed rulers, then plot the lengths.
What kids practice
In a scaled graph, each picture or each step on the side of a bar graph stands for more than 1, like 2, 5 or 10. Third graders read and make these graphs and answer "how many more" and "how many fewer" questions. They also measure lengths to the nearest half inch and show them on a line plot, where each X stands for one thing that was measured.
Watch for
- Counting each picture as 1 and ignoring the key.
- Reading a bar that stops between two lines as the line below it.
- Starting a ruler at 1 instead of 0 when measuring.
It's free to print, with Fewer, Standard or More on the page and an answer key. See the full scaled graphs and line plots guide for 3rd grade.
More sheets in this set
- See it all
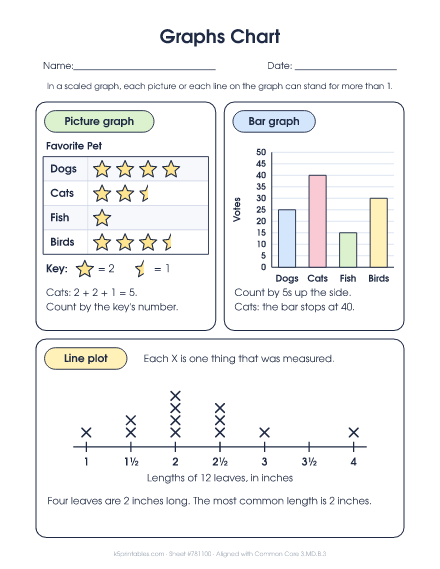 1. Graphs ChartA picture graph where each picture stands for 2, a bar graph counting by 5s, and a line plot.
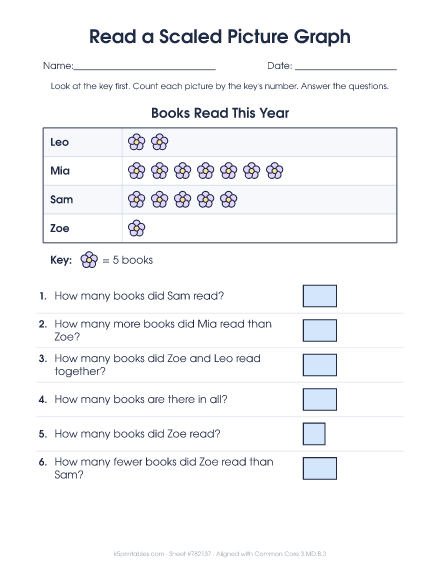 2. Read a Scaled Picture GraphPicture graphs where each picture stands for 2, 5 or 10, including half pictures.
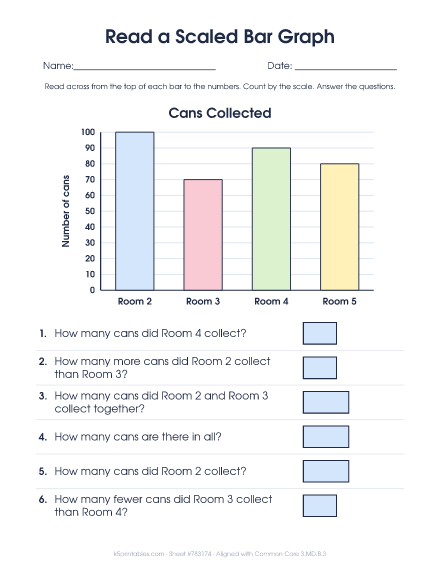 3. Read a Scaled Bar GraphBar graphs on a scale of 2, 5 or 10 with how many, how many more and how many in all questions.
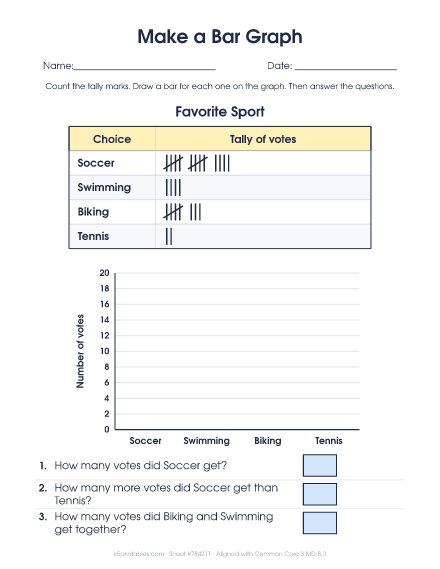 4. Make a Bar GraphTurn a tally table into a bar graph that counts by 2s or 5s.
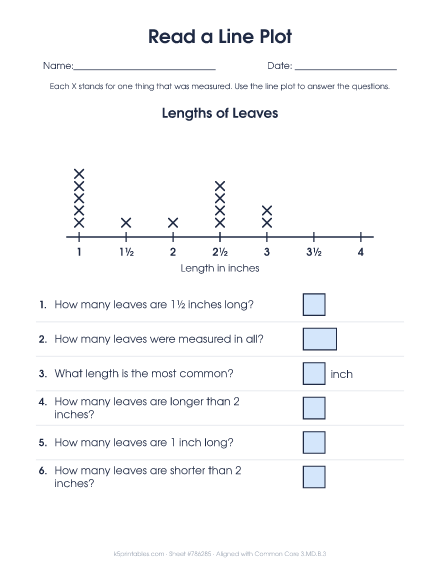 6. Read a Line PlotLine plots of leaves, pencils, shells and more, measured to the nearest half inch, with questions.