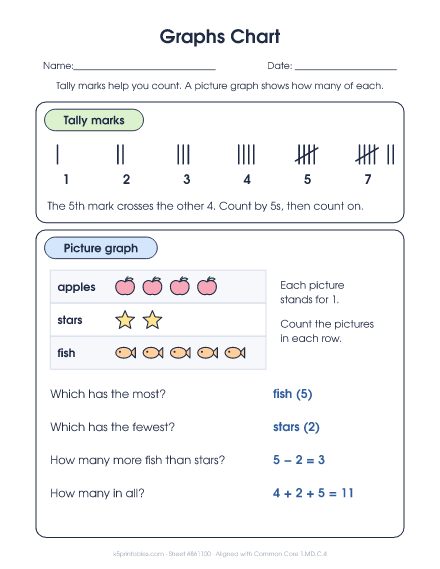
Tally and Graph
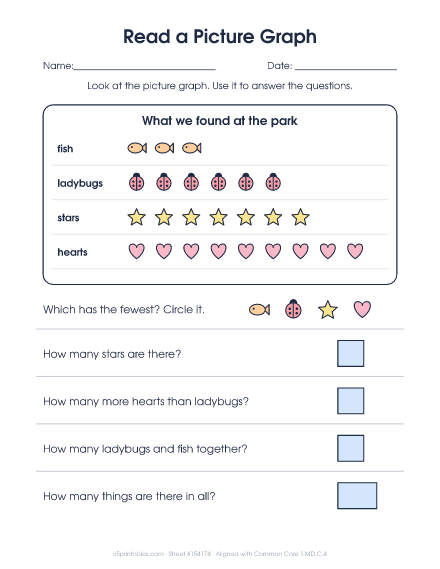
Count each kind of picture. Make tally marks, then color the graph.
Fresh sheet anytime. Tap New sheet or reload for a different one. Tap + for up to 10.
This is sheet #15324601.
How to do it
- Count each kind of picture. Make a tally mark for each.
- Color one box on the graph for each one.
- Answer the questions.
Teaching tip
Have your child cross off each picture after making its tally mark. This sheet is aligned with Common Core 1.MD.C.4.
About this worksheet
A scatter of three kinds of pictures to tally, graph and answer questions about.
What kids practice
Graphs are a way to sort and count things so you can see the answer at a glance. First graders sort things into up to three groups, count each group, and answer questions like "Which has the most?" and "How many more?"
Watch for
- Counting the same picture twice or skipping one. Crossing off each one as it's counted helps.
- Coloring the bar graph from the top instead of the bottom.
- For "how many more", giving one of the numbers instead of the difference.
It's free to print, with an answer key. See the full graphs with three categories guide for 1st grade.